|
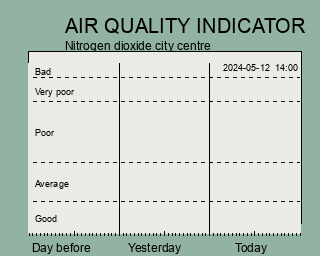
The indicator is based on hourly monitoring in main streets in the city
centre and is automatically updated on the www every hour.
The hourly values are raw data.
The EMMA scale is proposed in the EC project EMMA as a common scale for air
quality indicators.
The annual mean concentrations in main streets in Stockholm city centre
exceed the EU limit value for health protection.
|
| Stockholm Air Quality Indicators, last hour: |
|---|
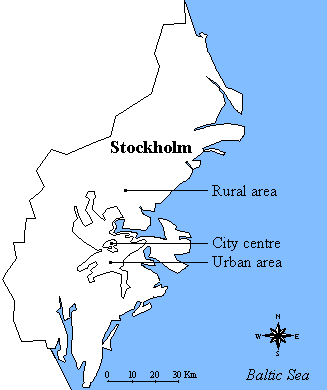
| Map region | NO2 | O3 | CO | PM 10 |
|---|
| City centre: |
 |
- |
 |
- |
|---|
| Urban area: |
 |
 |
- |
 |
|---|
| Rural area: |
 |
 |
- | - |
|---|
Klick on the rectangles above to see latest three days of data
for each air quality indicator |
|

